You should spend about 20 minutes on this task.
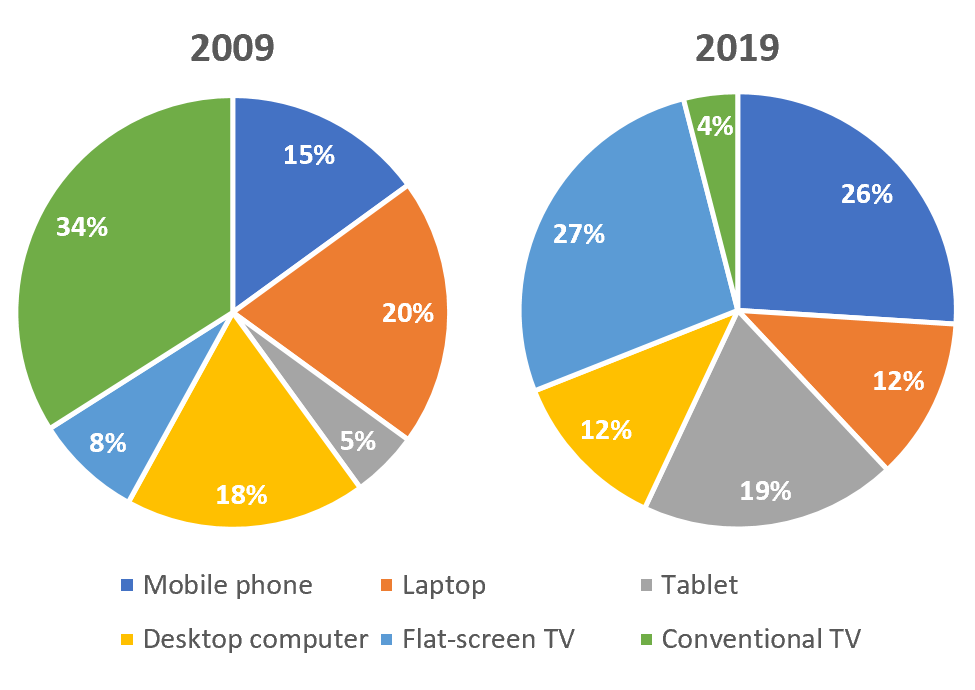
The pie charts below show the devices people in the 18 to 25 age group use to watch television in Canada in two different years.
Summarise the information by selecting and reporting the main features, and make comparisons where relevant.
Write at least 150 words.

Model answer
The two charts illustrate 6 types of appliances that people aged 18 to 25 in Canada utilized for watching television in 2019 and 2019.
Overall, it can be seen that the use of traditional TV sets, laptop and desktop computers decreased significantly while the new technological gadgets gained their popularity as television viewing devices.
The ten-year period starting from 2009 witnessed the sharp decline of conventional TV for viewing purposes from 34% to 4%. Laptop and desktop computers experienced the same pattern in which the figures for the former fell from almost a fifth to 12% and the number of the latter shrank by one third from 18% to 12%.
On the other hand, there was a dramatic growth of modern devices used by Canadians for watching television. Flat-screen TV jumped from 8% in 2019 to over a forth, making it the top device in terms of television viewing. Increasingly favored by young Canadians, cell phones rocketed from 15% to 26% and tablets underwent an almost four-fold increase to 19% in 2019.
(172 words)


